
Have consumers discovered a hidden tax on women’s products?
It has been claimed that women are charged more than men for more-or-less the same product on the high street.
Accusations of “sexist” pricing have been identifiable since the 90s, with the issue re-emerging in recent months following comparison of over 800 products in the United States by the New York City Department of Consumer Affairs (NYCDCA) and a similar study in the United Kingdom by The Times.
The research concluded that products marketed for women cost 7% more on average than their male variants in the US and 37% more in the UK. Women’s products were also priced highest in 42% of the US sample.
alva has followed recent discussion around gender pricing and quantified the ramifications for reputation across different product markets. We monitored 20,277 pieces of content across the US and UK that made reference to the subject. All data was drawn from publicly available sources including print, online and social media between September 2015 to February 2016.
In this analysis we seek to address the following questions:
- How has the issue of gender pricing permeated the UK and US?
- In which product markets do we find the greatest consumer concern around gender pricing?
- How have retailers responded to this issue?
A month-on-month view of gender pricing discussion in the US and UK
Figure 1: Discussion on gender pricing: US & UK
.
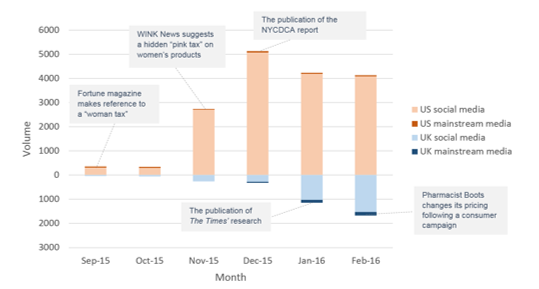
Concern for gender pricing emerged in September precipitated by a US national debate around gender wage disparity, with mainstream media making reference to terms such as “woman tax” and “pink tax”. Although interest peaked around the release of the NYCDCA report in December, the issue continued to be discussed subsequently through criticism by campaigner Chelsea Clinton and YouTuber Ingrid Nilsen even raising the issue to President Obama. In contrast, UK discussion increased post-publication as retailers began to respond publicly to the denunciation.
US and UK consumer negativity for gender pricing across different products*
Figure 2: US consumer negativity
.
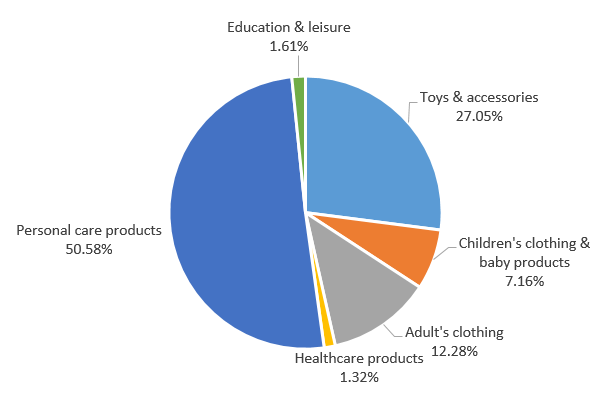
Figure 3: UK consumer negativity
.
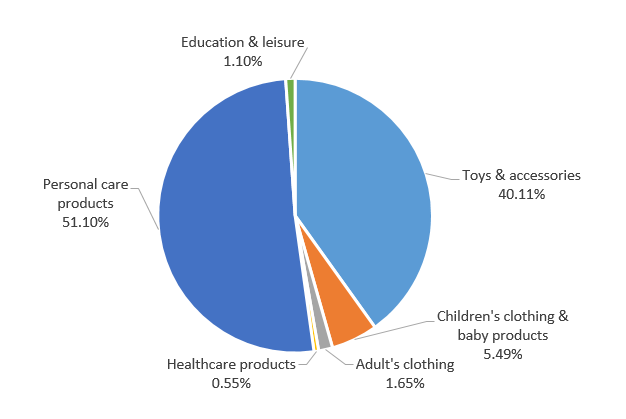
- Personal care products
Across samples, over half of all concern centred around personal care products (US & UK average: 50.54%). Consumers most frequently highlighted the product examples that featured in the research publications, including pink vs blue razors (UK) and Walgreens’ female vs male marketed shampoo (US). A London-based campaign also forced visibility around the sale of women’s eye cream by pharmacist Boots, which cost 27% more than the male variant. These items in particular were identified for being purchased across all age groups, which emphasised that “women pay more… their whole lives” and may explain why this product area received the most attention from dedicated Twitter campaign account @SexistSurcharge.
- Children’s toys & accessories
Although emerging second in terms of volume (US & UK average: 33.58%), it was within this group that consumers identified the most expansive list of affected products. Such items ranged from a pink scooter costing twice the amount compared to its red variant (Radio Flyer, US) to a fairy themed toy set for girls costing 16% more than a pirate themed set of the same size and brand for boys (Amazon, UK), with consumers encouraged to share their own gender pricing experiences through campaign platforms @fawcettsociety and @LetToysBeToys on Twitter. This product group may be particularly vulnerable as a large proportion of children’s items are marketed by gender, with a number of consumer contributions referencing gendered variants that were displayed side by side by retailers. Consumers that identified themselves as parents also contributed to concern by sharing the NYCDCA’s research conclusions around this market.
- Adult’s clothing
We saw the largest regional disparity within adult clothing, with US consumers complaining of a price hike for women’s garments (US: 12.58%; UK: 1.65%). The most frequently highlighted example was Levi’s additional $20 charge for its women’s 501 jeans, following its inclusion in the NYCDCA research and a Tweeted complaint by Fox News presenter Maria Tellez. Additionally, 29.41% of the US sample discussed how as a woman they have purchased or intend to purchase men’s clothing due to the “better price and material”.
Retailers’ response to the disparity**
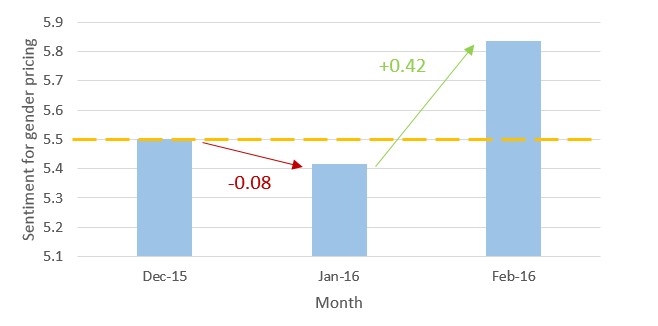
To date only pharmacist Boots has made progress in recovering its damaged reputation, with its decision to change the pricing of affected products influencing a +0.42 rise in sentiment across content referencing gender pricing.
Figure 4: Sentiment around gender pricing for Boots (US & UK)
.
Key findings
The discovery of a gender bias in pricing is a very real concern for consumers, re-emerging in the last few months across the US and UK. Although a number of retailers have been embroiled in the pricing denunciation, only one has made progress in recovering its damaged reputation by proactively changing its pricing of affected products.
- Over half of consumer concern centred around personal care products as these items tend to be purchased across a lifetime
- Children’s toys and accessories are particularly vulnerable to consumer exposure as a large proportion of these products are marketed by gender
- Almost a third of US consumers discussed the purchasing of men’s garments as a woman due to the “better price and material”
*Products were categorised using some of the following examples: Toys & accessories included toys, bikes & video games; Personal care products included razors, shampoo & hairspray; Healthcare products included supports, braces and compression socks; Education & leisure included pens, books & magazines.
**The alva algorithm calculates sentiment scores out of 10, where a score of 5.50 is considered neutral. A score above 6.00 is considered strong, while a score of 5.00 is considered weak.
Related posts


Be part of the
Stakeholder Intelligence community